
Mastering Excel: Count Unique Values, Round Numbers, and Generate Random Data
Microsoft Excel is a powerful tool for data analysis, but its full potential is often untapped. This comprehensive guide will equip you with essential Excel skills, focusing on efficiently counting unique values, effectively using the COUNTIF function, and generating random numbers. Well explore various techniques, from simple counting methods to more advanced functions, ensuring you can confidently tackle a wide range of data manipulation tasks. Whether you need to analyze survey results, manage inventory, or perform statistical analysis, mastering these techniques will significantly enhance your productivity and data analysis capabilities. This article aims to provide a clear and concise understanding of these core functions, guiding you through practical examples and step-by-step instructions. Lets delve into the details.
Table
Counting Unique Values in Excel: A Step-by-Step Guide
One of the most frequent tasks in data analysis is determining the number of unique values within a dataset. Understanding how to count unique values in excel is crucial for various applications, from identifying the number of distinct customers in a sales report to determining the variety of products in an inventory. There are several ways to achieve this, ranging from simple methods suitable for smaller datasets to more sophisticated techniques for larger, more complex spreadsheets. The simplest method for how to count unique values in excel involves using the built-in features and functions.
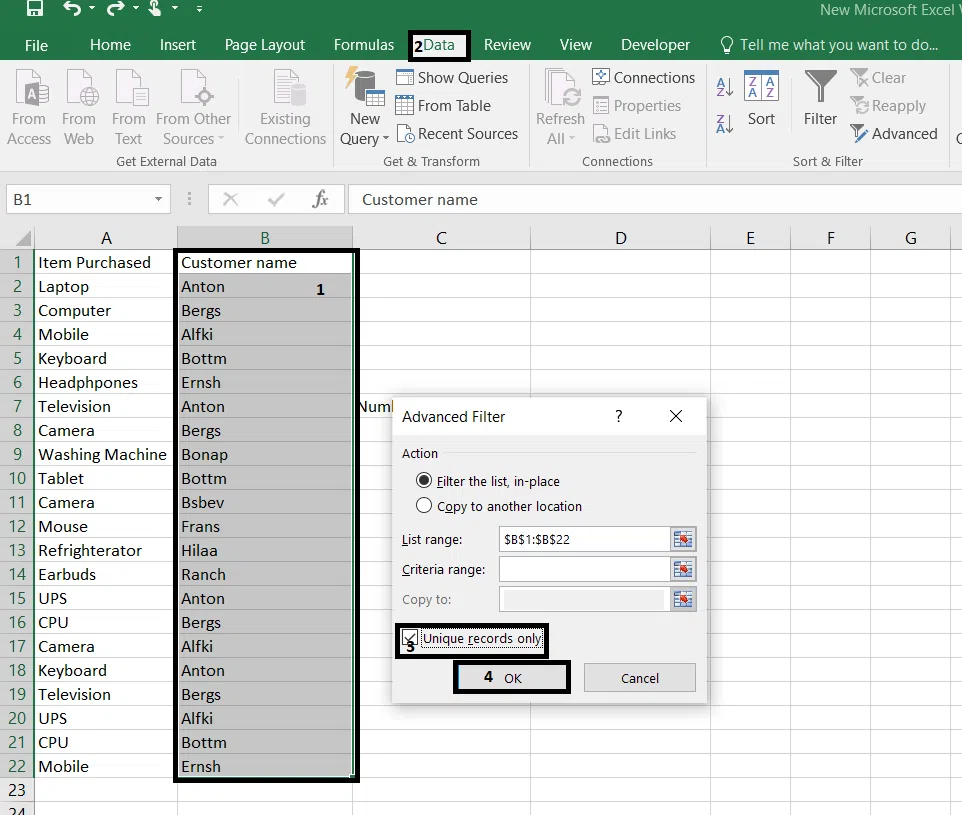
Using the Advanced Filter for Unique Values
For smaller datasets, using Excels built-in filter is a straightforward approach. First, select the data range containing the values you want to count. Then, navigate to the Data tab and click Advanced. Choose Copy to another location, tick the box Unique records only, and specify the output range. After clicking OK, Excel will list only the unique values. Manually counting these gives you the total number of unique items. This method provides a visual representation of the unique values, which can be helpful for further analysis. Its an effective answer to the question: how to count unique values in excel for those new to the program.
Leveraging the COUNTIF Function for Unique Value Counting
While the advanced filter is useful, its not ideal for larger datasets or automated processes. A more robust method involves using the COUNTIF function in conjunction with other Excel capabilities. Learning how do i use countif in excel is essential to tackling this problem effectively. The function counts the number of cells within a range that meet a given criterion. To count unique values, youll need to use it iteratively, creating a helper column to track unique values. This method is often more efficient than using the advanced filter, particularly with large spreadsheets, directly addressing how to count distinct values in excel.
Utilizing Pivot Tables for Efficient Unique Value Counting
For more complex datasets, pivot tables are invaluable. Pivot tables offer a powerful and flexible way to summarize and analyze data. To count unique values, simply drag the column containing your data into the Rows area of the pivot table. Excel will automatically list all unique values, displaying their frequency. This eliminates the need for complex formulas, making it a quick and intuitive solution for how to count distinct values in excel. The added benefit is the ability to easily filter and sort your data. Learning to use pivot tables significantly speeds up your data analysis workflow, particularly when dealing with questions like how to count distinct values in excel within large data sets.
Advanced Techniques: Using Array Formulas for Unique Value Counting
For a highly efficient solution, especially for how to count unique values in excel within very large datasets, array formulas provide a powerful option. Array formulas are a type of Excel function that operates on multiple cells at once, providing advanced analytical capabilities. While these are more complex, they can significantly improve performance when dealing with extremely large amounts of data. Understanding these advanced methods represents a more sophisticated approach to how to count distinct values in excel.
Mastering COUNTIF: Advanced Applications in Excel
The COUNTIF function is a fundamental Excel tool. Understanding how to do countif in excel opens up a world of possibilities for data analysis and reporting. This function lets you count the number of cells within a given range that meet a specific criterion. This allows you to analyze data subsets based on various criteria, providing more granular insights than simple counting. Many users struggle with how do you use countif in excel; a clear understanding of its application is essential.
Basic COUNTIF: Counting Specific Values
The most basic application of how to do countif in excel is counting the number of times a specific value appears in a range of cells. For example, to count the number of times the word Yes appears in a column, the formula would be =COUNTIF(range,Yes). Replace range with the actual cell range you are examining. This simple function quickly provides answers for questions such as how to count number of yes in excel, saving significant time over manual counting.
COUNTIF with Wildcards: Flexible Value Counting
How do i use countif in excel to find values that match partial criteria? The answer lies in wildcards. COUNTIF supports the use of wildcards, , which represents any sequence of characters, and ?, which represents a single character. This allows for more flexible searches. For instance, to count all cells starting with Apple, the formula would be =COUNTIF(range,Apple). This demonstrates a very practical application of how to use countif in excel for more flexible data analysis.
COUNTIFS: Multiple Criteria Counting
When dealing with more than one criterion, the COUNTIFS function comes into play. How do you use countif in excel when you need to examine several conditions simultaneously? COUNTIFS allows you to specify multiple criteria and count cells that meet all of those criteria. For example, to count cells that contain both Apple and Red, the formula might look like =COUNTIFS(range1,Apple*,range2,Red). Understanding this aspect of how to use countifs in excel empowers you to perform more sophisticated data analysis.
Practical Examples of COUNTIF and COUNTIFS
Imagine analyzing survey results. You could use how to use countif in excel to count the number of respondents who answered Yes to a particular question. Or, using how to use countifs in excel, you could count the number of respondents who answered Yes to one question and No to another. This illustrates the power and flexibility of these functions in real-world data analysis scenarios, making how do you use countif in excel a critically important skill.
Generating Random Numbers and Data in Excel
Random number generation is a valuable tool for simulations, data testing, and various other applications within Excel. Understanding how to choose random numbers in excel opens up opportunities for more advanced data manipulation and analysis tasks. Excel offers several functions to facilitate this, making the process straightforward and efficient. Whether you need to create a sample dataset, simulate a process, or simply need a random number for a specific task, this section will show you the techniques you need.
Using the RAND Function for Random Number Generation
The simplest method for how to choose random numbers in excel is using the RAND function. The =RAND() function generates a random number between 0 and 1. To generate a random number within a specific range, you can adjust this formula. For example, to generate a random number between 1 and 100, you would use =RAND()*100+1. This is a foundational step in understanding how to generate random numbers in excel. This allows you to quickly and easily create a range of random numbers to meet the needs of your specific project.
Generating Random Integers using RANDBETWEEN
Often, you'll need random integers instead of decimals. The RANDBETWEEN(bottom,top) function generates a random integer between a specified lower and upper bound (inclusive). This provides more control and specificity over the type of random numbers generated, providing a more effective answer to how do you generate random numbers in excel for a variety of tasks. This is particularly useful for tasks that require whole numbers, ensuring a direct and useful application of your random number generation within Excel.
Advanced Random Number Generation: Incorporating Other Functions
Combining RAND or RANDBETWEEN with other functions allows you to create more complex scenarios. For example, you can combine it with the ROW() function to generate a sequence of random numbers in a column, solving how to generate random numbers in excel within a range in a more dynamic way. This demonstrates the power of integrating random number generation into more complex processes within your Excel data analysis.
Practical Applications of Random Number Generation
The ability to how to generate random numbers in excel is essential in numerous situations. For instance, you might use it to simulate sales figures, test a hypothesis, or even randomly select participants for a study. Understanding these techniques opens up a wide array of possibilities for more advanced data modeling and analysis within Excel. The versatile nature of this function allows you to approach many tasks in a new way, opening up new perspectives within your analytical workflow.
Mastering these core Excel skills – counting unique values, utilizing COUNTIF and COUNTIFS, and generating random numbers – significantly enhances your data analysis capabilities. Whether you're a novice or an experienced Excel user, this guide provides practical techniques and examples to improve your efficiency and unlock the full potential of this powerful software.
This video might interest you: give it a watch
Mastering Bullet Points in Microsoft Excel: A Comprehensive Guide

Mastering Date Sorting and Management in Microsoft Excel

Mastering Excel Filtering: A Comprehensive Guide to Data Management

Mastering Hyperlinks in Excel: A Comprehensive Guide

Recover Lost or Corrupted Excel Files: A Comprehensive Guide

Mastering Excel File Size Reduction: Practical Strategies for Smaller, Faster Spreadsheets
Leave a Reply
Contenido relacionado