
Mastering Excel: Your Comprehensive Guide to Finding Mean, P-Values, and More
Microsoft Excel is a powerful tool for data analysis, offering a wide array of functions to handle statistical calculations and data manipulation. This comprehensive guide will walk you through various essential functions, focusing on how to find the mean in Excel, alongside other crucial statistical measures and data management techniques. We’ll cover calculating the mean (average), understanding p-values, standard deviation (how to find stdev in excel), and searching within your spreadsheets. Beyond the basics, we’ll delve into more advanced functions like finding quartiles (how to find quartiles in excel), confidence intervals (how to find confidence interval in excel), and regression analysis (how to find regression in excel). Whether youre a novice looking for a simple way to find the mean using excel or an experienced user seeking to enhance your analytical skills, this guide provides a clear and step-by-step approach to leverage Excels full potential.
Table
Calculating Averages and Understanding Descriptive Statistics in Excel
One of the most fundamental statistical calculations is finding the mean, or average, of a dataset. Learning how to find mean in excel is crucial for any data analysis task. Excel provides the AVERAGE function for this purpose. Simply select the cells containing your data and use the formula =AVERAGE(range), replacing range with the actual cell range. For instance, if your data is in cells A1 to A10, the formula would be =AVERAGE(A1:A10). This simple function forms the foundation for many more advanced statistical analyses within Excel. Understanding how to find mean with excel is the first step towards more complex data interpretations.
Understanding Mean, Median and Mode
While the AVERAGE function readily provides the mean, it’s important to understand its distinction from the median and mode. The median represents the middle value in a sorted dataset, and the mode is the most frequently occurring value. Excel offers functions like MEDIAN(range) and MODE(range) to calculate these respective values. Knowing how to find mean in excel, coupled with calculating the median and mode, gives a more comprehensive understanding of the dataset's central tendency. It also highlights the potential impact of outliers which can significantly skew the mean, whereas the median remains less affected.
Calculating Standard Deviation (how to find stdev in excel) and Variance (how to find variance in excel)
Standard deviation (how to find stdev in excel), represented as sd or stdev, measures the dispersion or spread of data around the mean. A larger standard deviation indicates greater variability. Excel's STDEV function calculates the sample standard deviation, while STDEVP calculates the population standard deviation. Similarly, variance (how to find variance in excel), the square of the standard deviation, provides another measure of data spread. The VAR and VARP functions calculate sample and population variance respectively. Understanding how to find stdev in excel and how to find variance in excel is vital for assessing data reliability and making informed decisions.
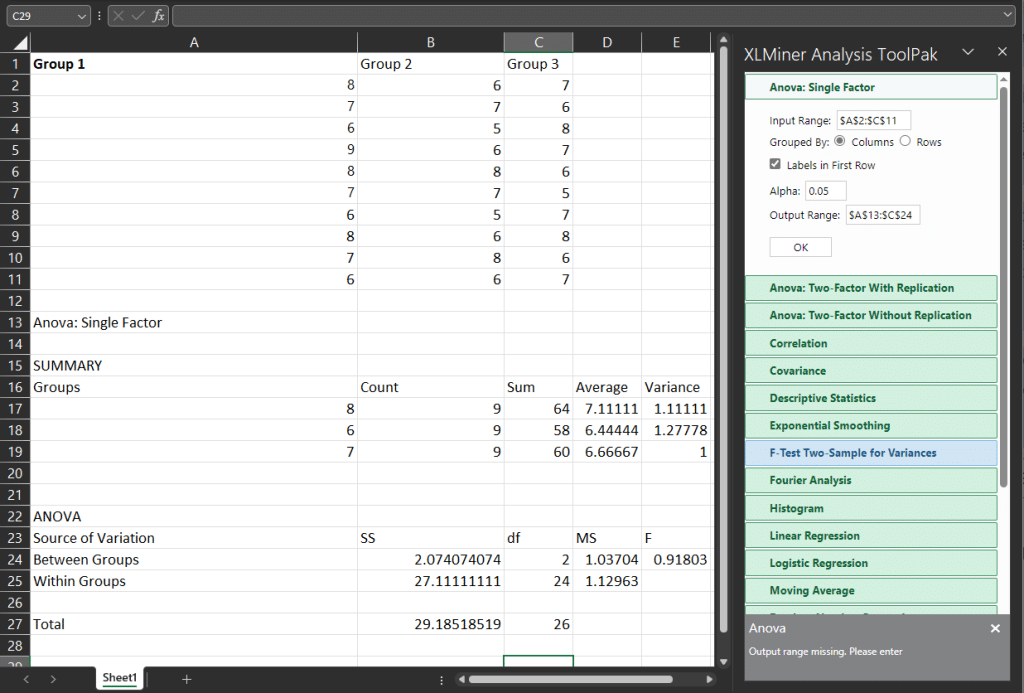
Using Descriptive Statistics for a Comprehensive Overview (how to find descriptive statistics in excel)
Excels Data Analysis ToolPak provides a comprehensive summary of descriptive statistics, including mean, median, mode, standard deviation (how to find stdev in excel), variance (how to find variance in excel), and much more. This tool allows you to quickly gain insights into your datas characteristics. Activating the Data Analysis ToolPak (instructions readily available online via a simple search like how to find developer in excel) unlocks a powerful suite of statistical analysis tools. This is a crucial step for any serious data analysis project in Excel. Knowing how to find descriptive statistics in excel will dramatically improve the efficiency of your analysis process.
How to Find Sigma in Excel
In statistical analysis, sigma often represents the standard deviation. Therefore, to find sigma in Excel, you would use the same functions explained above: STDEV for sample standard deviation and STDEVP for population standard deviation. The understanding of how to find sigma in excel is crucial for interpreting data related to process capability and control charts.
Hypothesis Testing and P-Values in Excel
Understanding how to find p value in excel is essential for hypothesis testing. A p-value represents the probability of obtaining results as extreme as, or more extreme than, those observed, assuming the null hypothesis is true. A low p-value (typically below 0.05) suggests evidence against the null hypothesis, leading to its rejection. Excel doesn't directly calculate p-values for all tests, but it provides the necessary statistical functions to derive them. For example, for t-tests, you might use the T.TEST function (after understanding how to find t stat in excel or how to find t statistic in excel). For other tests you might need to use other functions and additional calculations.
How to Find P-Value in Excel using T.TEST
The T.TEST function in Excel calculates the p-value for a t-test, a common statistical test used to compare means between two groups. It requires inputting the data ranges of both groups and specifying the type of t-test (paired or two-sample). Understanding how to find p value using excel via T.TEST is an essential skill for analysing paired and independent sample data.
How to Find P-Value Using Other Excel Functions
Besides T.TEST, other functions like Z.TEST and CHISQ.TEST enable p-value calculation for z-tests and chi-squared tests respectively. Learning how to find p value with excel using these diverse functions allows you to apply statistical analysis across a wider range of scenarios, making your data interpretation significantly more robust.
Interpreting P-Values
It's crucial to interpret p-values correctly. A small p-value, often below a significance level (e.g., 0.05, which you can find the information on how to find significance level in excel), indicates that the observed results are unlikely under the null hypothesis. However, a large p-value doesn’t necessarily prove the null hypothesis; it simply suggests insufficient evidence to reject it. Understanding how to find a p value in excel is only half the battle; correct interpretation is just as important for drawing accurate conclusions.
How to Find a P-Value on Excel for Different Statistical Tests
The method for finding the p-value varies depending on the statistical test being used. Excel provides different functions for different types of tests: T.TEST for t-tests, Z.TEST for z-tests, F.TEST for F-tests, and CHISQ.TEST for chi-squared tests. Knowing which test is appropriate for your data and how to find a p value on excel for each is essential for accurate analysis.
Advanced Excel Techniques for Data Analysis
Beyond basic calculations, Excel offers advanced features for sophisticated data analysis. These tools include functions for finding confidence intervals (how to find confidence interval in excel), regressions (how to find regression in excel), and more. These capabilities empower you to conduct in-depth analyses and draw well-supported conclusions from your data.
Confidence Intervals (how to find confidence interval in excel)
Confidence intervals provide a range of values within which a population parameter (like the mean) is likely to fall with a certain level of confidence. Excel facilitates the calculation of confidence intervals using the CONFIDENCE function. This function requires specifying the confidence level (how to find confidence level in excel) and the standard deviation. Learning how to find a confidence interval in excel allows for a much more nuanced presentation of data uncertainty.
Regression Analysis (how to find regression in excel)
Regression analysis helps determine the relationship between variables. Excel's Data Analysis ToolPak provides tools for performing linear regression, allowing you to identify trends and make predictions. Learning how to find regression in excel is vital for understanding and predicting relationships within your datasets, such as in econometrics or other data-rich fields.
Finding Other Statistical Measures: IQR, Z-scores, and More
Excel also enables the calculation of other important statistical measures. The interquartile range (IQR) (how to find iqr in excel), representing the spread of the middle 50% of the data, can be found using functions that find quartiles (how to find quartiles in excel) or the 5 number summary (how to find 5 number summary in excel). Z-scores (how to find z score using excel), which standardize data to a mean of 0 and a standard deviation of 1, can be calculated using the STANDARDIZE function. These functions aid in analysing data variation, outlier detection, and statistical comparisons.
Data Searching and Manipulation: How to Search in Excel
Efficiently searching through large datasets is essential. Excel offers several ways to accomplish this. The built-in Find and Replace functionality is useful for simple searches (how to find and replace in excel), while more advanced techniques such as using VLOOKUP or INDEX and MATCH functions (how to do lookup in excel, how to use lookup in excel, how lookup works in excel) can be used for more complex data retrieval. Learning how to search in excel efficiently is crucial for managing and analysing large datasets.
This guide provides a solid foundation for using Excel for data analysis. Further exploration of Excel’s capabilities, including functions like NPV (how to find npv in excel), IRR (how to find irr on excel), and others will continue to enhance your data analysis skills and facilitate even more in-depth and efficient analysis. Remember to consult Excel's help documentation and online resources for more detailed information on specific functions and techniques. Mastering these tools transforms Excel from a spreadsheet program into a powerful analytical engine.
This video might interest you: give it a watch
Secure Your Excel Files: A Comprehensive Guide to Password Protection and Removal

Mastering Excel: A Comprehensive Guide to Essential Functions and Techniques

Unlocking Excel's Power: A Comprehensive Guide to Macros and More

Recover Hidden Data: Mastering Excel Column Management Techniques

Mastering Checkboxes in Microsoft Excel: A Comprehensive Guide

Mastering the Art of Adding Signatures in Microsoft Excel: A Comprehensive Guide
Leave a Reply
Contenido relacionado