
Mastering Excel: Your Comprehensive Guide to Calculating Differences and Variances
Microsoft Excel is a powerful tool for data analysis, but understanding its functions for calculating differences and variances is crucial for effective data interpretation. This comprehensive guide will walk you through various methods for determining differences between numbers, dates, and times in Excel, covering everything from simple subtractions to more complex calculations. We’ll explore how to find the difference between two cells, two columns, or even two entire Excel sheets. We will also touch upon the key differences between Excel and Power BI, to help you choose the right tool for your specific needs. Learning these techniques will significantly enhance your data analysis skills and empower you to extract meaningful insights from your spreadsheets.
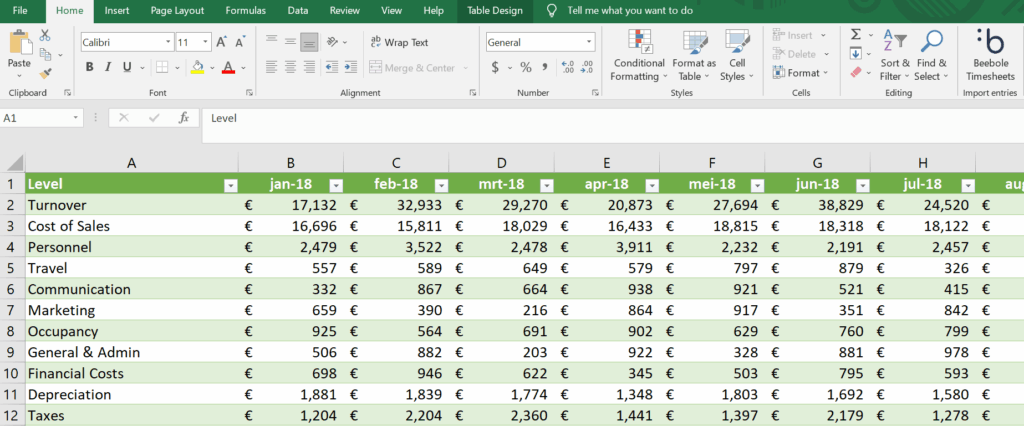
Table
Finding Differences Between Numbers and Cells in Excel
Calculating Simple Differences Between Two Numbers
The most basic method of finding the difference between two numbers in Excel is simply using the subtraction operator (-). For example, to find the difference between the values in cells A1 and B1, you would enter the formula “=A1-B1” into another cell. This is the foundation for many more complex difference calculations in Excel, providing a clear and efficient way to determine the numerical difference. This simple approach works effectively for finding the difference between two numbers in a spreadsheet, and forms the basis for more intricate calculations further along. Understanding this fundamental method is crucial before moving onto more advanced techniques like calculating differences between dates or times.
Finding the Difference Between Two Cells
To find the difference between any two cells, irrespective of their location within the spreadsheet, simply use the cell references in a subtraction formula. For instance, to calculate the difference between cell D5 and G12, the formula would be =D5-G12. This simple yet powerful technique allows for flexible calculation across different areas of your worksheet. This method is fundamental when working with large datasets where the relevant cells may not be located adjacently. It’s a cornerstone for performing comparative analysis between different data points in your Excel work.
Determining Differences Between Two Columns
To determine the difference between corresponding values in two columns, you can use a formula in a new column and then drag the formula down. For example, if Column A and Column B contain the values you want to compare, then the formula in cell C1 would be “=A1-B1”. You can then drag the little square in the bottom right corner of cell C1 down to apply this formula to all the rows in the spreadsheet. This method provides a comprehensive way to conduct a comparison across the entire dataset and facilitates a quick and efficient way to understand the differences between two columns of data. This simple yet effective approach is indispensable when performing detailed data analysis and comparisons.
How to Find the Difference Between Two Excel Sheets
Comparing data across different Excel sheets requires referencing the sheets directly within the formula. If you want to compare, say, cell A1 in Sheet1 and cell A1 in Sheet2, your formula would be =Sheet1!A1-Sheet2!A1. This is particularly useful for tracking changes over time or comparing data from different sources. This technique facilitates comparison between datasets contained in separate worksheets, a valuable asset for advanced data analysis tasks, allowing for effective comparisons between data held in different sheets.
Working with Dates and Times in Excel
How to Find the Difference Between Dates in Excel
Excel handles dates as serial numbers, making date difference calculations straightforward. To find the difference between two dates (e.g., in cells A1 and B1), use the formula “=B1-A1”. The result represents the number of days between the two dates. Formatting the cell as a number shows the exact difference. To find the difference between two dates, simply subtract the earlier date from the later date. This provides a very efficient means of comparing data across time. This simple calculation forms the basis for many more advanced analysis techniques based on temporal comparisons. Excel's built-in date handling functions are very useful for this.
How to Find Time Difference in Excel
Similar to dates, Excel treats times as fractional parts of a day. To find the time difference between two times (e.g., in cells C1 and D1), use the formula “=D1-C1”. The result will be a decimal representing the fraction of a day. To format this as hours, minutes, and seconds, change the cell's number format to a time format. This enables effective comparison and management of temporal data. This approach is incredibly useful for workflow optimization, project management, and scheduling applications, allowing precise comparison of durations.
How to Get Time Difference in Excel (Detailed)
For more detailed time difference analysis, you might need to extract specific components (hours, minutes, seconds). This can be achieved using functions like HOUR, MINUTE, and SECOND. For instance, to get the difference in hours, you’d use “=HOUR(D1-C1)”. Similarly, “=MINUTE(D1-C1)” and “=SECOND(D1-C1)” provide the minute and second differences respectively. This level of detail enables a deeper analysis of temporal differences, extracting specific elements which may be pertinent for specific contexts. This precision enables a granular analysis, suitable for situations requiring an in-depth understanding of the difference across time.
Calculating the Difference Between Two Times in Excel
Excel provides a straightforward means of determining the difference between two times using simple subtraction. For example, if cell E1 contains 9:00 AM and cell F1 contains 5:00 PM, the formula =F1-E1 will yield the difference, easily formatted as hours, minutes, and seconds if needed. This allows the user to swiftly identify the precise duration between two distinct times, a function useful in myriad applications. This is a quick and easy method for finding the duration between two points in time, allowing for effective time management.
Advanced Techniques and Comparisons
How to Find Percent Difference in Excel
Calculating the percentage difference between two numbers involves subtracting the smaller number from the larger number, dividing this by the larger number, and then multiplying by 100. In Excel, if the two numbers are in cells G1 and H1, the formula would be =(H1-G1)/H1*100. This calculation is crucial for comparing changes over time and understanding the magnitude of differences. This is useful for many analytical tasks requiring an understanding of proportional change rather than just absolute difference.
How to Find Correlation Between Two Variables in Excel
To determine the correlation between two variables (sets of data in columns), Excel provides the CORREL function. For instance, to find the correlation between data in columns I and J, the formula would be =CORREL(I:I,J:J). The resulting correlation coefficient (between -1 and 1) indicates the strength and direction of the linear relationship. Understanding correlation is important to identify if there’s a relationship between variables. This function allows analysis of the relationships between variables, providing valuable insights for predictive modelling and analysis.
How Is Power BI Different From Excel?
While Excel is excellent for data manipulation and analysis, Power BI excels in data visualization and interactive dashboards. Power BI is better suited for large datasets and complex analyses that require robust visualization tools. Excel focuses more on individual spreadsheet analysis, while Power BI supports collaborative data analysis and reporting. Choosing between the two depends on the scale and complexity of your data analysis tasks and visualization requirements. A key difference lies in their strengths: Excel shines in detailed data manipulation, while Power BI provides a superior platform for creating powerful interactive visualizations from significant datasets. This consideration is vital in selecting the optimal analytical tool for a given task.
This guide has shown you numerous methods for calculating differences and variances within Excel, from the most fundamental techniques to more advanced approaches. Mastering these tools empowers you to effectively analyse your data and uncover key insights.
This video might interest you: give it a watch
Mastering Excel File Size Reduction: Practical Strategies for Smaller, Faster Spreadsheets

Mastering Watermarks in Excel: A Comprehensive Guide

Secure Your Excel Files: A Comprehensive Guide to Password Protection and Removal

Mastering Excel: A Comprehensive Guide to Essential Functions and Techniques

Unlocking Excel's Power: A Comprehensive Guide to Macros and More

Recover Hidden Data: Mastering Excel Column Management Techniques
Leave a Reply
Contenido relacionado